WorkProduct/UX2025

Hachette Learning
The assessment platform that turns standardised test scores into question-level insight, and points teachers to the intervention that closes the gap.
- Product/UX
- Assessment
- Data UX
- Reporting
- EdTech
Overview
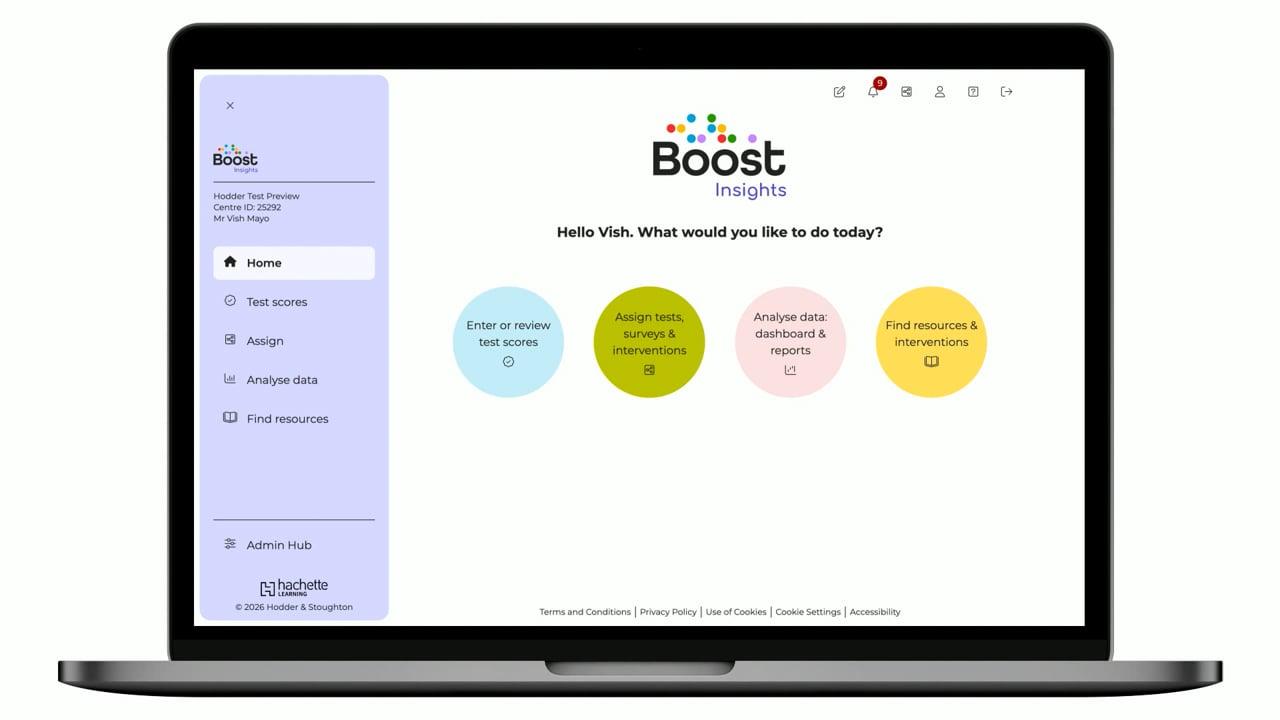
Boost Insights is the assessment layer of Boost Learning. It sits across a catalogue of standardised assessments, PiRA, PUMA, GaPS, NTS, Access and more, and joins up the whole cycle: enter or review learners' scores, analyse them through dashboards and reports, and act on them with resources and interventions. The design challenge was making standardised-assessment data legible and actionable, moving a teacher from rows of raw marks to 'here's the gap, here's who, here's what to do', in a few clicks between lessons.
Role
Senior Product Designer, research, UX & UI
Timeline
2025
Team
Cross-functional product team at Hachette Learning
Tools
Figma, Prototyping, Analytics review, Usability testing
The brief
Teachers sit standardised tests but the value is locked in the marking. Turning scores into meaning, gaps, strengths, who needs help and what to do next, meant spreadsheets and manual effort most teachers never had time for.
Marking data lived in spreadsheets, hard to read for patterns across a class.
No question- or strand-level breakdown to show exactly where learners struggled.
Comparing pupils against national averages and standardised scores meant manual work.
Even when a gap was clear, there was no direct route from the data to the intervention.
Research
I worked with teachers and assessment coordinators who run termly standardised assessments, and studied how they currently wring meaning out of the results. The pattern was consistent: they trust the tests, but the analysis is where it falls down, so insight arrives too late, too coarse, or not at all. That framed the whole platform around turning scores into targeted action.
Teachers want the gap, not the grid
Raw marks are noise; the signal is 'which questions and which strands did this class miss, versus the national picture'. Question-level analysis had to be the centre of gravity.
Standardised scores need context
A raw score means little on its own. Pairing it with standardised and age-standardised scores, and a national comparison, is what lets a teacher judge performance fairly.
Insight has to lead somewhere
Spotting a below-range learner is only useful if the next step is one click away. Linking reports to recommended intervention Learning Sequences closed the loop from data to teaching.
Journeys
The core journey runs from marking to action, and every screen is designed to shorten it: enter scores once, choose the right report, read the gaps against the national picture, then assign the resource or intervention that answers them.
Persona: Primary teacher / assessment coordinator running termly standardised assessments
Structure
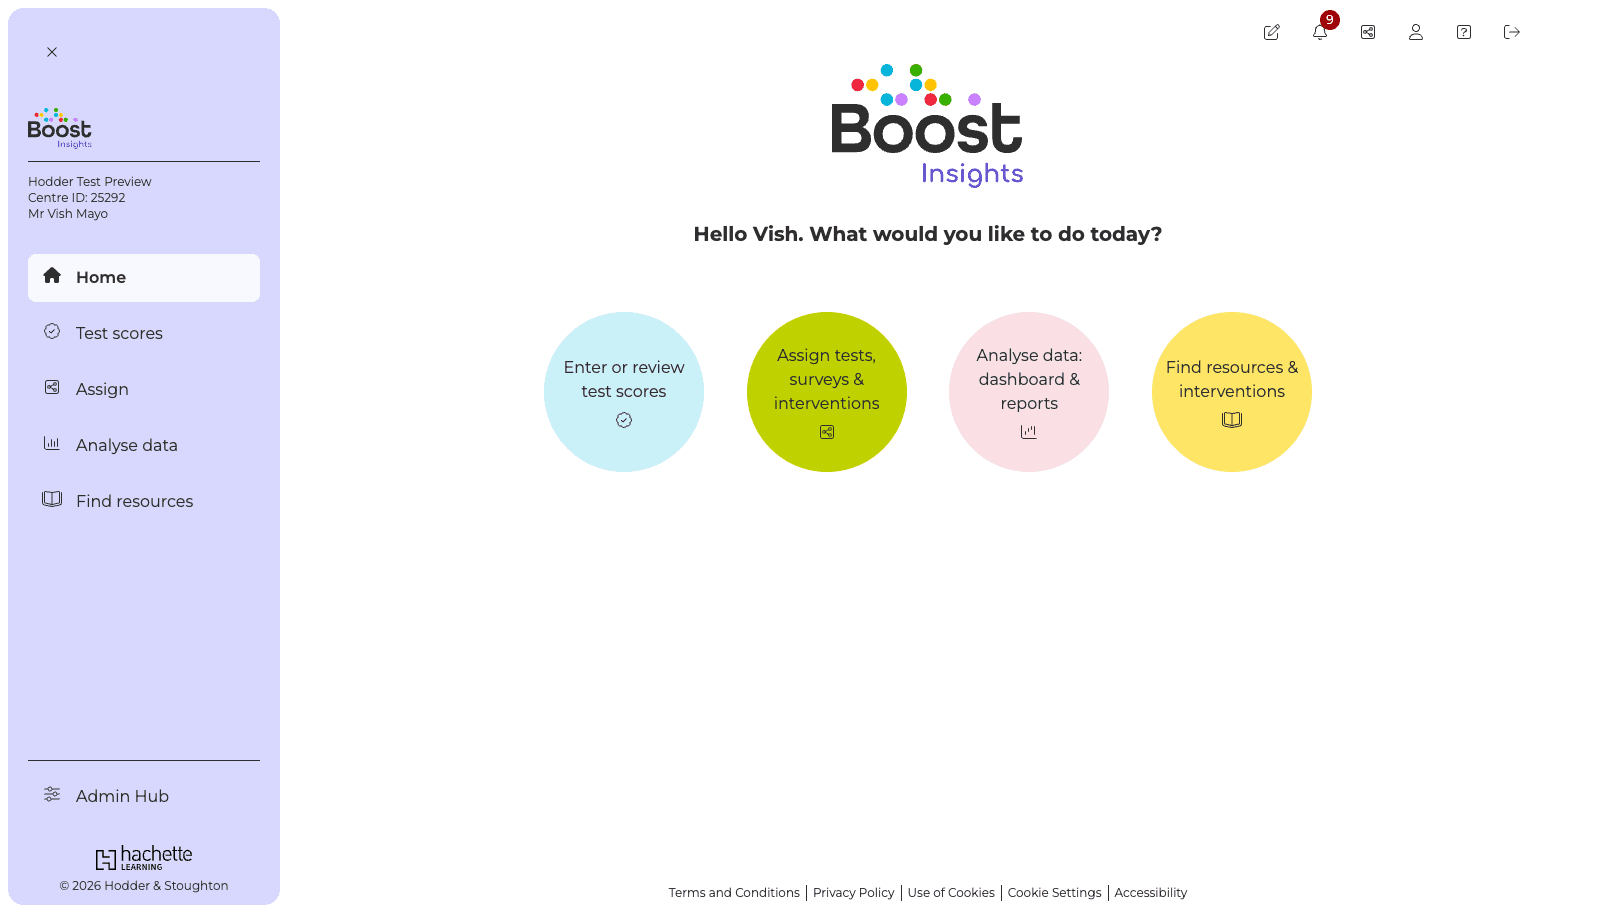
Home offers four clear jobs; analysis is organised as a funnel, product, then report, then learners, so a teacher narrows from a catalogue to a single class in a few decisive steps.
User journey
Before a pixel was designed, I mapped every route through the platform end to end, from the dashboard and top navigation down to entering marks, generating each report and assigning interventions. It's the blueprint the screens were built from. Expand any step to go deeper.
Highlights
From a home that offers four clear jobs to a question-level analysis that reads at a glance, the platform turns standardised marking into targeted teaching.
System
A friendly, data-first system: Montserrat throughout, a Boost purple accent on a soft lilac chrome, and a disciplined use of colour where it carries meaning, the four task areas, and correct / incorrect / not-attempted in the analysis grids.
Colour
Boost purple
#7C3AED
Lilac
#D8D8FF
Lilac tint
#F8F7FF
Ink
#2E2E2E
Border
#E5E7EB
Reading blue
#CAF0F8
Assign green
#BFD200
Analyse pink
#FAE0E4
Resources yellow
#FFE566
Type scale
Display
Montserrat · 34 / 42
Heading
Montserrat · 24 / 30
Body
Montserrat · 16 / 24
Label
Montserrat · 13 / 16
Spacing rhythm
- xs4px
- sm8px
- md16px
- lg24px
- xl40px
- 2xl64px
Components
Task circle
The four home routes, each a colour-coded circle with an icon.
Product card
An assessment suite with its logo, credit balance and favourite toggle.
Report card
A report type with a preview thumbnail and a digital / PDF tag.
QLA grid
Marks by question and strand, colour-coded correct / incorrect / not attempted against the national average.
Standardised score display
Raw, standardised and age-standardised scores shown together for fair judgement.
Marksheet
A purpose-built grid for entering or reviewing scores per paper.
Impact
Teachers enter scores once and Insights generates the marksheets, reports and question-level analysis automatically, then points them at the intervention for learners working below range, turning marking into targeted teaching rather than admin.
Marking becomes question-level insight and a next step, in a few clicks.
One analysis layer across PiRA, PUMA, GaPS, NTS, Access and more.
Every result read against national averages and standardised scores.
Reflection
The win was turning marking into meaning: every screen had to move a teacher from 'here are the scores' to 'here's what to do'. Making question- and strand-level gaps obvious, and wiring them straight to interventions, was what made the data worth entering. Next: predictive flags and deeper drill-down from cohort to individual learner over time.
Next case study
A cultural society's website, reimagined with ticketing, memberships and an admin area to stay organised and operate from.